NVIDIA's NeMo Relay shows what your AI agent actually did
NVIDIA has shown how to record every model call, tool call and retry an agent makes, then line that trace up against a simple pass or fail verdict.
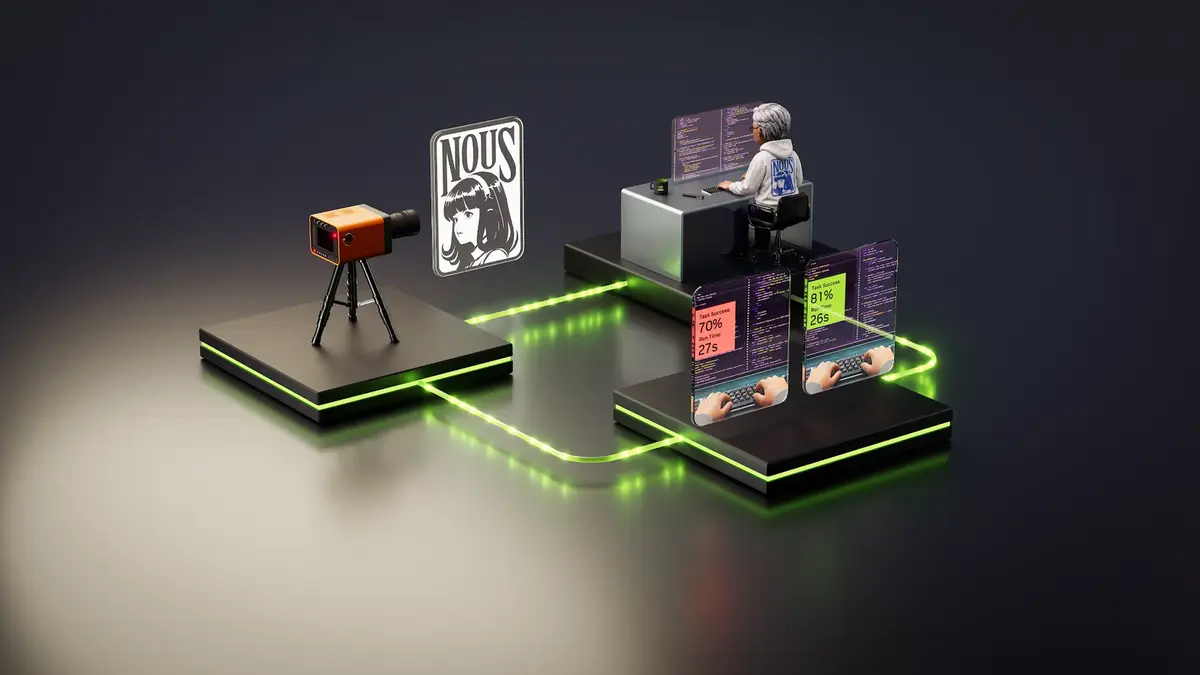
NVIDIA has published a walkthrough showing how to trace what an AI agent actually does between receiving a prompt and returning an answer. The tracing layer is NeMo Relay, and the worked example is Hermes Agent, which carries native NeMo Relay support and represents its sessions, turns, model calls and tool calls inside the framework's scope hierarchy.
A passing result is not enough
The starting observation is that an agent can finish a task and still take a wasteful route to get there. A failed search can trigger another search. A truncated file read can lead to a command that fetches the same content again. The final answer looks correct while latency and token use climb, and every extra step is another chance for the run to fail.
NVIDIA's argument is that a success check on its own cannot explain why an agent recovered from a tool error, stopped early or needed extra model calls. Pairing the verdict with a trace is what turns a harness change into something measurable rather than a matter of impression.
Three ways to read a run
NeMo Relay records lifecycle events as work begins and ends, preserving timing and parent-child relationships, and exposes a run in three shapes. The Agent Trajectory Observability Format is a JSONL log of scope starts, scope ends and point-in-time marks, useful for debugging individual events. The Agent Trajectory Interchange Format assembles those events into a step-by-step record of interactions, tool calls and observations. A third export writes OpenTelemetry spans with OpenInference labels for agent, LLM and tool activity, which is what lets the data land in dashboards a team already runs.
The tutorial exercises two tasks and inspects the traces they produce. The first is a simple terminal tool task, where the run's event stream and trajectory are read directly. The second is a combined file-and-web research task, whose OpenTelemetry trace is explored in Arize Phoenix. In both cases the point is to compare model and tool calls, errors, retries, duration and token use against the task's own verification result.
Setup is deliberately disposable. The instructions clone NVIDIA's nemoclaw-community repository, run a setup script that builds a self-contained runtime with Python 3.11, a pinned Hermes Agent build and NeMo Relay, then add an NVIDIA Build API key for Nemotron 3.5 Lightning. Docker is used only for the terminal sandbox and the local Phoenix service, so nothing in an existing Python install is touched.
Why the middle of the run matters
Most agent failures are not dramatic. A harness change can shave a model call and read as a win, or quietly add a retry loop that only shows up on long tasks. Tracing moves that from anecdote to evidence, because the trace records the path rather than the destination.
Our opinion
The trace formats are the least interesting part of this. What matters is that NVIDIA is arguing for the comparison, not the log: a verification pass tells you whether the agent succeeded, while a trace tells you whether the harness got better or simply got luckier on the day. That distinction is the difference between profiling an agent and merely monitoring it, and it is the reason this kind of tooling belongs next to the eval harness rather than beside the infrastructure dashboard.
The open question is whether the industry settles on one trace shape or keeps exporting three. NVIDIA covering all three formats in the same tutorial is an admission that no one has won yet, and the OpenTelemetry path is the honest bet while that remains true.