Google Sheets adds stock charts and fixes Excel imports
Google Sheets can now draw high-low-close and open-high-low-close stock charts, and it no longer drops those charts when an Excel file is imported.
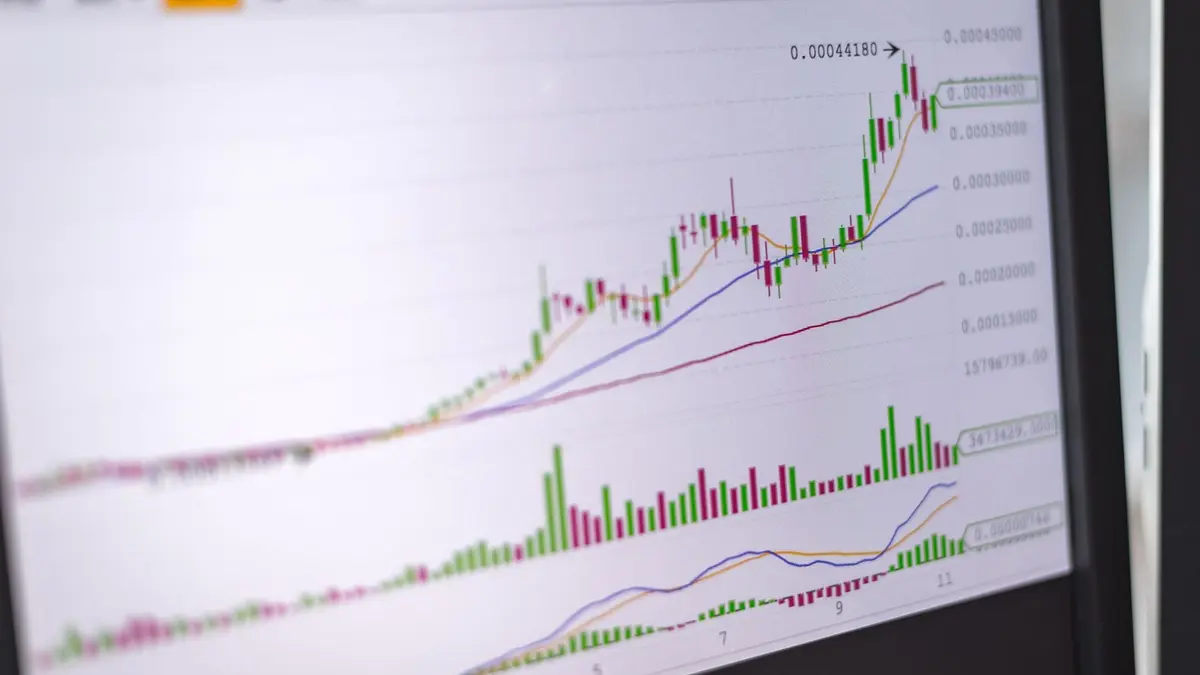
Google Sheets has picked up the one chart type its finance-minded users kept asking for, and fixed what happened to it on the way in from Excel. The two new chart types were announced on 5 October 2026 in a Google Workspace rapid release.
Stock charts condense several price points for a period into a single marker. Instead of reading a security's daily high, low and close off separate lines, the chart shows the whole trading range in one shape — the same idea behind the candlestick charts most trading desks use.
Two new chart types
The first, High-Low-Close (HLC), plots the highest price, the lowest price and the closing price for each period, showing both the trading range and where the period settled. The second, Open-High-Low-Close (OHLC), adds the opening price so a single marker tells you whether the period closed up or down.
Both are aimed at the work analysts already do in Sheets: tracking equities and commodities, and building valuation models on historical price data. The controls sit with the other chart options, so a range of dated prices can become a stock chart without a plug-in.
The Excel import fix matters as much
The quieter change is to imports. Sheets previously discarded stock charts when an Excel file containing them was opened, which meant anyone moving a model between the two applications lost the visualisation and had to rebuild it by hand. That gap is now closed, and the imported charts arrive as the same HLC and OHLC types.
Google has published the update as a rapid release, which is its term for features that reach Workspace customers over a short rollout rather than on a scheduled track. Administrators do not need to enable anything.
Photo by AlphaTradeZone on Pexels
Our opinion
The headline feature is a chart type that competing tools have had for years, so the real news is the second paragraph. Google's productivity suite has historically been strongest when a file never leaves it; the weak seam has always been the Excel hand-off, where structure survives but anything more visual quietly does not. Closing that seam is a smaller announcement and a more useful one.
Stock charts also hint at who Sheets is being built for now. Finance teams quietly run enormous models in the browser because the collaboration is worth more than the missing furniture, and every skipped plug-in is a spreadsheet that stops drifting out of sync with the team around it. That is a durable reason to switch, and it is cheaper to earn than an AI feature nobody asked for.